Recheck Codebook
Statistical Assumption
- Open the SPSS datafile.
- Click Analyze > Reports > Codebook.
- In the Variables tab: Add the variables you want in the codebook to the Codebook Variables box. To include all variables, click inside the Variables box, press Ctrl + A, then click the arrow button.
- In the Output tab: (Optional) Choose what variable and datafile properties you want to be included in the codebook:
- Variable information: By default, includes Position, Label, Type, Format, Measurement level, Role, Value labels, Missing values, and Custom attributes.
- File information: None included by default.
- Variable display order: By default, ordered identically to how the variables are ordered in the file. Can also order alphabetically, by file, or by measurement level.
- Maximum number of categories: By default, limits to 200 categories.
- In the Statistics tab: (Optional) Choose what statistics you want in the codebook. By default, counts and percents will be printed for nominal and ordinal variables, and mean, standard deviation, and quartiles will be printed for scale variables.
- When finished, click OK.
Statistical Assumption
To test the assumption of normality, a
variety of methods are available, but the simplest is to inspect the data
visually using a tool like a histogram (Figure 1). Real-world data are almost
never perfectly normal, so this assumption can be considered reasonably met if
the shape looks approximately symmetric and bell-shaped. The data in the
example figure below is approximately normally distributed.
Figure 1
Figure 2: Histogram for Total Scores Memory
Functioning Self-Report Time 1 (TotMfs1)
Figure 3: Total Scores Memory Functioning Self-Report Time 2 (TotMfs2)
Figure 4: Histogram for Total
Scores Epwotr Sleepiness Time 1 (TotEss1)
Figure 5: Total Scores Epworth
Sleepiness Time 2 ( TotEss2)
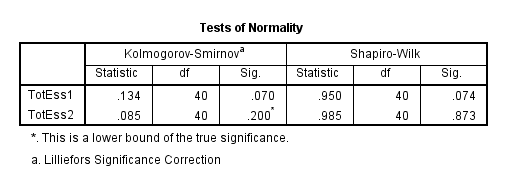
In the table above labelled Test of Normality, we are given
the result of Kolmogorov-Smirnov statistic. This assesses the
normality of the distribution of scores. A non-significant result (Sig. value
of more than .05) indicates normality. In this case, the Sig.value
for both scales Memory Functioning Self-Report(MFS) 1 & 2 and Epworth
Sleepiness (ESS)1 & 2 is more than .05. thus, its show the scores is
normality distribution.


No comments:
Post a Comment